Shades of Gray in SVG - How to Get a Sharp Black Line
22 March 2015 - HTML, HTML5, SVG
In HTML5 the new <svg> element was introduced. It allows you to embed SVG graphics in html. You can build really cool things with svg - from fancy looking interactive charts to games running in the browser. At http://www.creativebloq.com/design/examples-svg-7112785 you can find some nice demos. But what if you just want to draw a straight 1px line? Well, that's not that easy. I got lots of different results for different browsers.
Lines in SVG
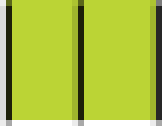
The following svg builds a green rectangle with three vertical black lines:
<svg height="20" width="25">
    <rect fill="#bbd435" height="100%" width="100%" y="0" x="0"></rect>
    <line stroke="black" stroke-width="1" y2="100%" y1="0" x2="0" x1="0"></line>
    <line stroke="black" stroke-width="1" y2="100%" y1="0" x2="12" x1="12"></line>
    <line stroke="black" stroke-width="1" y2="100%" y1="0" x2="25" x1="25"></line>
</svg>
On my PC I got the following results with the browsers IE11, Chrome 41.0.2272.76, and Firefox 36.0.1. The row "Zoom 100%" shows a screenshot of the svg with zoom level 100% in the browser. For the line "Zoom 600%" I have zoomed into this screenshot with Gimp and have taken a screenshot of the zoomed view.
| Internet Explorer | Chrome | Firefox | |
|---|---|---|---|
| Zoom 100% |

|

|

|
| Zoom 600% |
|

|

|
The results are very different for these three browsers. The images even get different sizes - IE: 27 x 21px, Chrome: 27 x 22px, and Firefox: 25 x 20px.
Rectangles in SVG
The best solution in my scenario was to replace all lines by rectangles with a width of 1px. Additionally, I had to use the shape rendering mode crispEdges. The last rectangle must be placed in row 24 instead of 25 as it exactly fills this pixel row instead of trying to draw a line between two pixel rows.
<svg width="25" height="20">
    <rect x="0" y="0" width="100%" height="100%" fill="#bbd435"></rect>
    <rect x="0" y="0" width="1" height="100%" fill="black" shape-rendering="crispEdges"></rect>
    <rect x="12" y="0" width="1" height="100%" fill="black" shape-rendering="crispEdges"></rect>
    <rect x="24" y="0" width="1" height="100%" fill="black" shape-rendering="crispEdges"></rect>
</svg>
This was the only combination of svg elements and attributes that worked for all three browsers on my PC:
| Internet Explorer | Chrome | Firefox | |
|---|---|---|---|
| Zoom 100% |

|

|

|
| Zoom 600% |

|

|

|
But even now chrome generates a larger image than the other two, and Firefox makes the last pixel line a bit brighter than the rest of the green rectangle.
Attributes Influencing the Visualization of Lines
To find out how to get the best result for sharp lines in different browsers I have collected all parameters that may influence the visualization. Finally, I came up with five factors:
- the shape (line or rectangle)
- using a <viewBox> or not
- using integer or decimal values for the coordinates
- the shape-rendering attribute
- the vector-effect attribute
Shape
You can use the <line> or the <rect> element to display 1px lines. At first sight it seems obvious to use the <line> element to draw a line. But the problem with a line is, that when using integer coordinates, the line is centered between two pixel rows. So you do not get a sharp 1px line, but instead you get a 2px line with a lightened color. There is a good description of this problem at When Pixels Snap.
Rectangles behaves differently. When you specify integer coordinates for a rectangle with a width of 1px, the rectangle is drawn exactly on one pixel row.
View Box
With the <viewBox> you can define the coordinate system of your svg graphic. viewBox="0 0 10 20" means that the top left corner has the coordinates 0,0 whereas the bottom right corner has the coordinates 10,20. You can find more information about view boxes at SVG Viewport and View Box. If the ratio of width and length of your svg graphic and the viewBox do not match, you can use the preserveAspectRatio attribute to specify how the graphic should stretch to fill the viewport.
If the available size for your SVG graphic is 100px and you specify a viewbox width of 10, every stroke with 1 unit width will become 10px wide. You can set the vector-effect attribute to non-scaling-stroke to keep the original size (see below).
Integer or Decimal
You can use integer (<rect x1="0" x2="0" ... />) or decimal (<rect x1="0.5" x2="0.5" ... />) coordinates for your shapes. Depending on the shape (and the browser) you will get a sharp or a blurred line. Lines are drawn between pixel rows so you should add 0.5 to the coordinates to get sharp lines. Rectangles are drawn on pixel rows, so you can use integer values to draw sharp lines.
Shape Rendering
With the shape-rendering attribute you can specify how you want the browser to render <path> elements and basic shapes like <line> or <rectangle>. The four possible values are auto, optimizeSpeed, crispEdges, and geometricPrecision.
In my example I had to use the value crispEdges with a rectangle to produce sharp lines in all three browsers. In Chrome optimizeSpeed worked too, and in IE all values worked with rectangles. With lines it did not work.
Vector Effect (Only for View Box)
If you are using a <viewBox>, all strokes are scaled to the defined view box size. That means if your graphic has a width of 100px and you define a view box with a width of 10 units, a stroke with 1 unit will become 10px wide. The vector-effect attribute non-scaling-stroke allows you to suppress this behavior for strokes. Unfortunately, there is no equivalent for text. It is not possible to keep the specified text size in a view box. A work around to get this behavior for text is to nest svg elements. You can find an example at stackoverflow. But even for strokes the attribute does not work in all browsers. Internet Explorer does not support this attribute at the moment: https://connect.microsoft.com/IE/feedback/details/788819/svg-non-scaling-stroke.
Test Different Combinations in Your Browser
The following example shows a grid with different combinations of elements and attributes to draw lines. In the top area you can specify a default value for each influencing factor. In the grid below the default value is used except for the rows and columns where the factor is overridden. If you select the default value Rectangle for the used shape, all graphics will use rectangles to draw the lines except the row and the column with the caption Line.
With this example you can test all combinations on your PCs and browsers. Hover over the graphic to get a tooltip with the rendered HTML.
Content

Tags
.NET (40) ADC (1) Android (1) Angular (4) AngularJS (3) ASP.NET (7) ASPNET Core (1) ASPNET (1) Assembler (1) Azure (62) BASTA (2) Blazor (2) C# (35) C (1) CLI (2) Cloud (1) CoderDojo (1) Conferences and Workshops (2) Container (4) CPP (3) CSharp (5) DevOps (2) Docker (12) Documentation (1) DotNet (1) ECMAScript (1) GAB (1) HTML (2) HTML5 (2) Iron Python (1) JavaScript (3) JWT (1) Markdown (1) MEF (3) Microservices (3) Microsoft (2) Minecraft (2) Mobile (2) Node (1) Node.js (2) NPM (1) OData (5) Presentations (4) Project Management (2) Registry (1) Roslyn (2) Silverlight (3) Software Quality Days (1) SPA (1) SQL (3) SQLCE (1) SVG (1) TechDays (1) Techorama (1) Testing (1) TFS (9) time cockpit (4) TypeScript (18) Visual Studio (37) VSCode (1) VSTS (2) WebAssembly (2) Windows (1) WPF (9) Yarn (1)Authors
Related Posts
RESTful Web API Design
18 September 2015 - AngularJS, HTML5, OData, TypeScript
Yesterday I did a workshop at the Software Architecture Summit in Berlin. More than 60 software architects came to my sessions about RESTful Web API Design. In this blog article I share my slides, code, and links to tools/technologies I mentioned. I hope you find the resources useful.

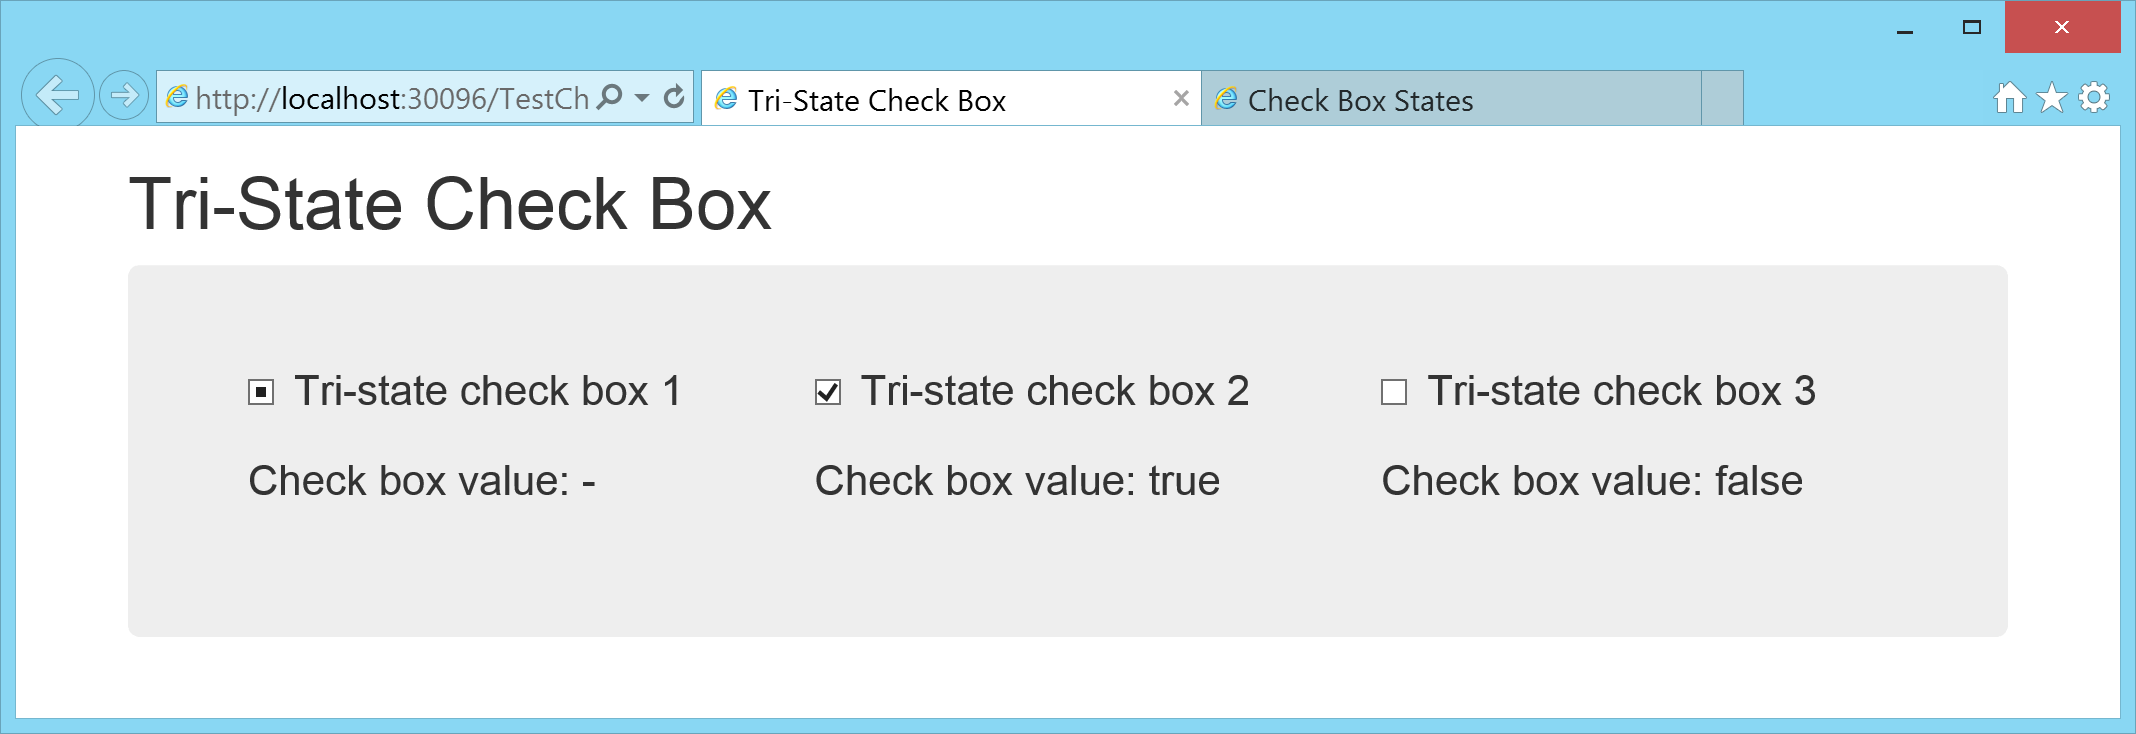
Tri-State Check Box in HTML with AngularJS and TypeScript
26 February 2015 - AngularJS, HTML, TypeScript
HTML does not support tri-state checkboxes by default. There is an indeterminate attribute to indicate that the value is undefined but there is no way to set a checkbox back to indeterminate through the user interface once it has been checked or unchecked. The following sample shows how to build an AngularJS directive for a tri-state checkbox with TypeScript.